
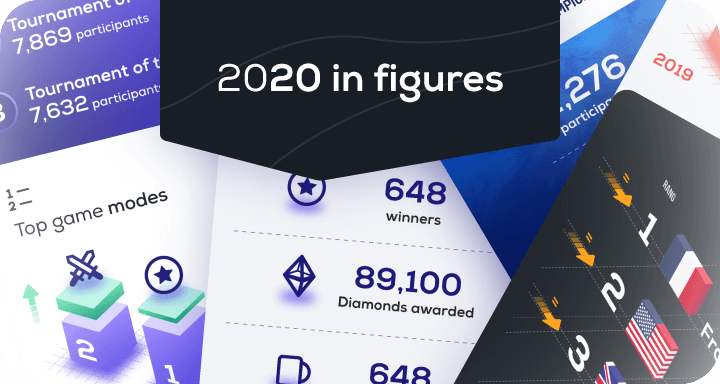
Your 2020 Year in Figures
Happy New Year from everyone at Funbridge! 🥳
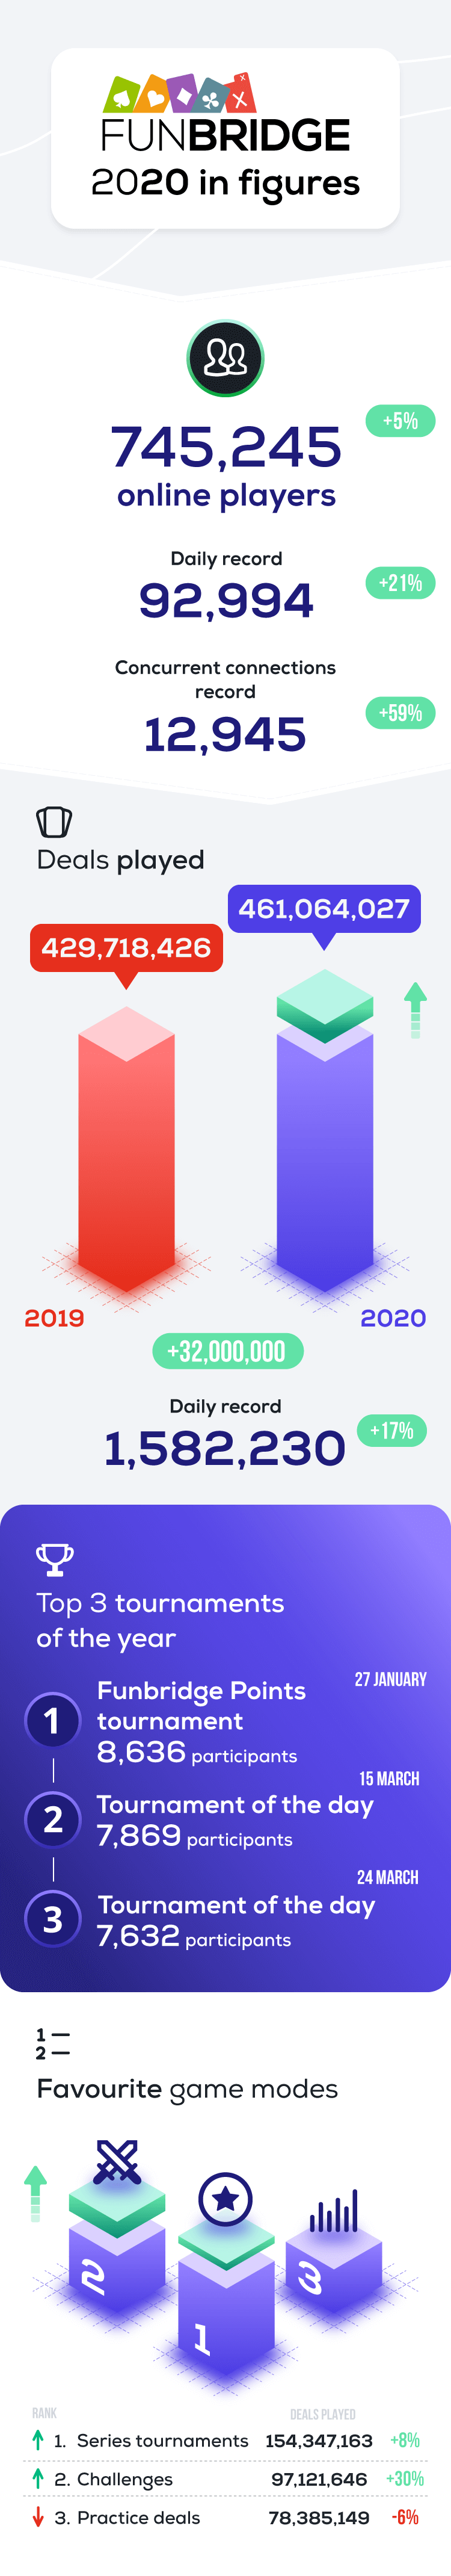
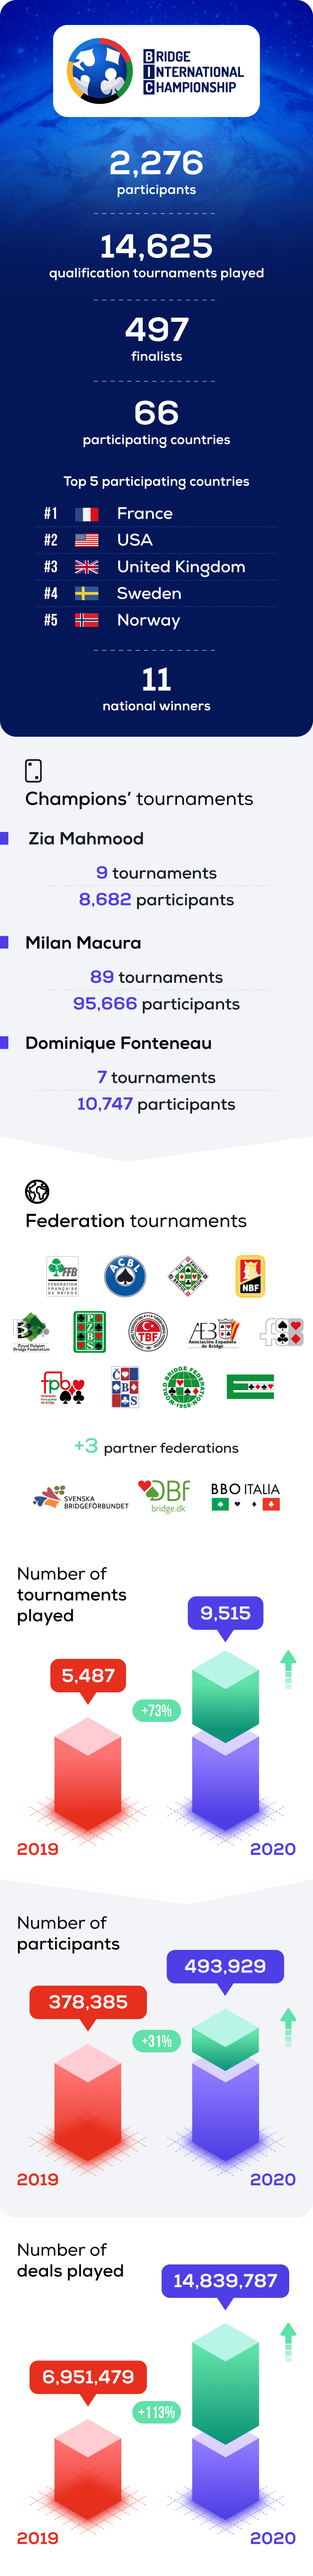
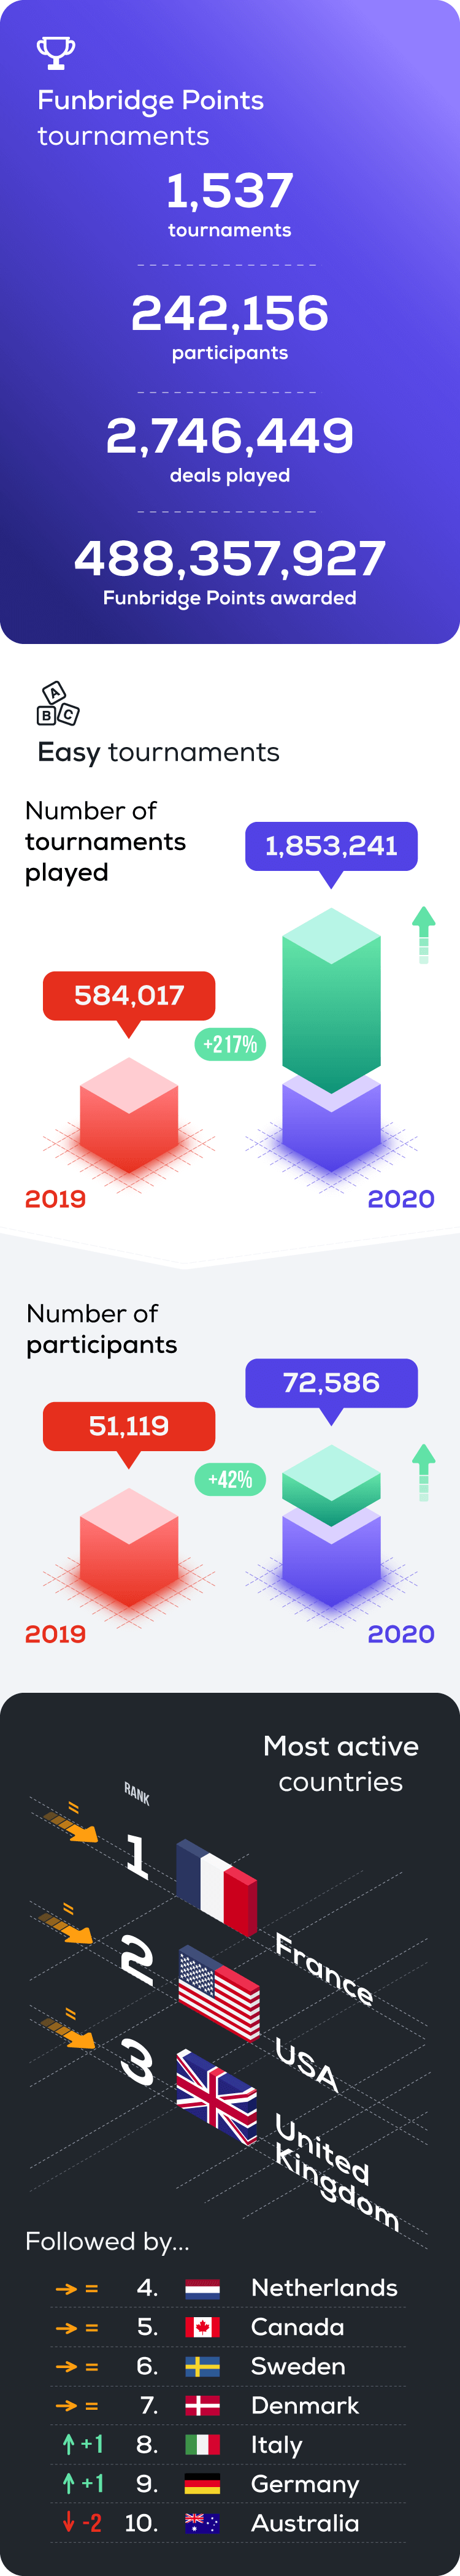
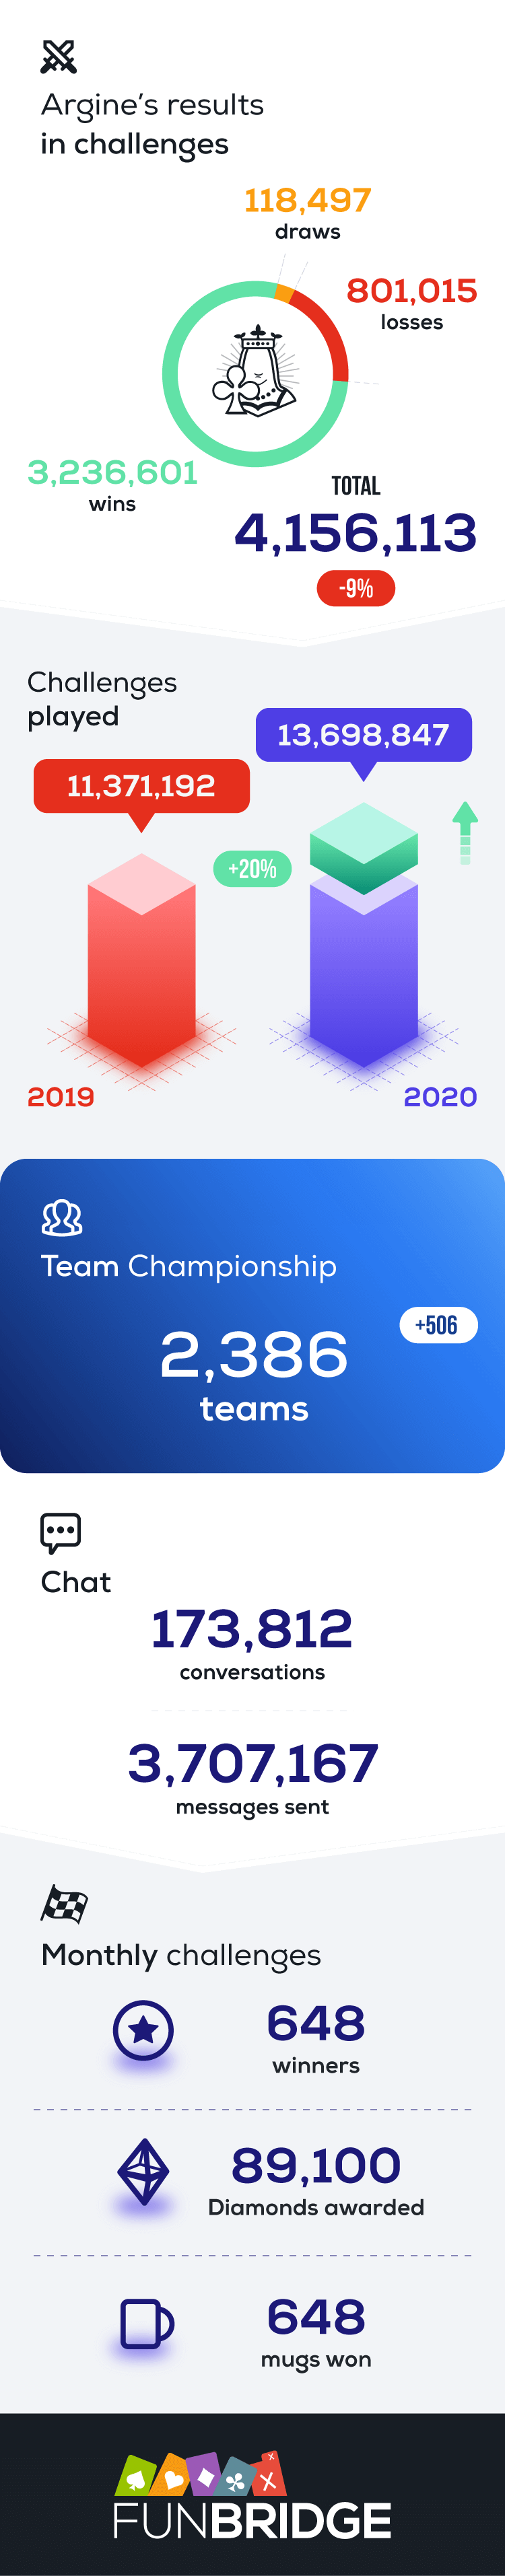
Like every year, the yearly Funbridge infographic is out! Find out more about how many people play on Funbridge, their favourite game modes, the most active countries and much more.
Enjoy reading it!
What do you think about it?
Feel free to comment on this infographic in the comments section below and to share it with your bridge players friends on social networks!


the numbers are important but not as impressive as I would have expected in a year of look down, to stay more and more at the top, I believe we need to improve the quality of the computer game and above all reduce the number of times that in the same situations game the computer behaves differently.
To everybody I wish a good game
I agree wholeheartedly