
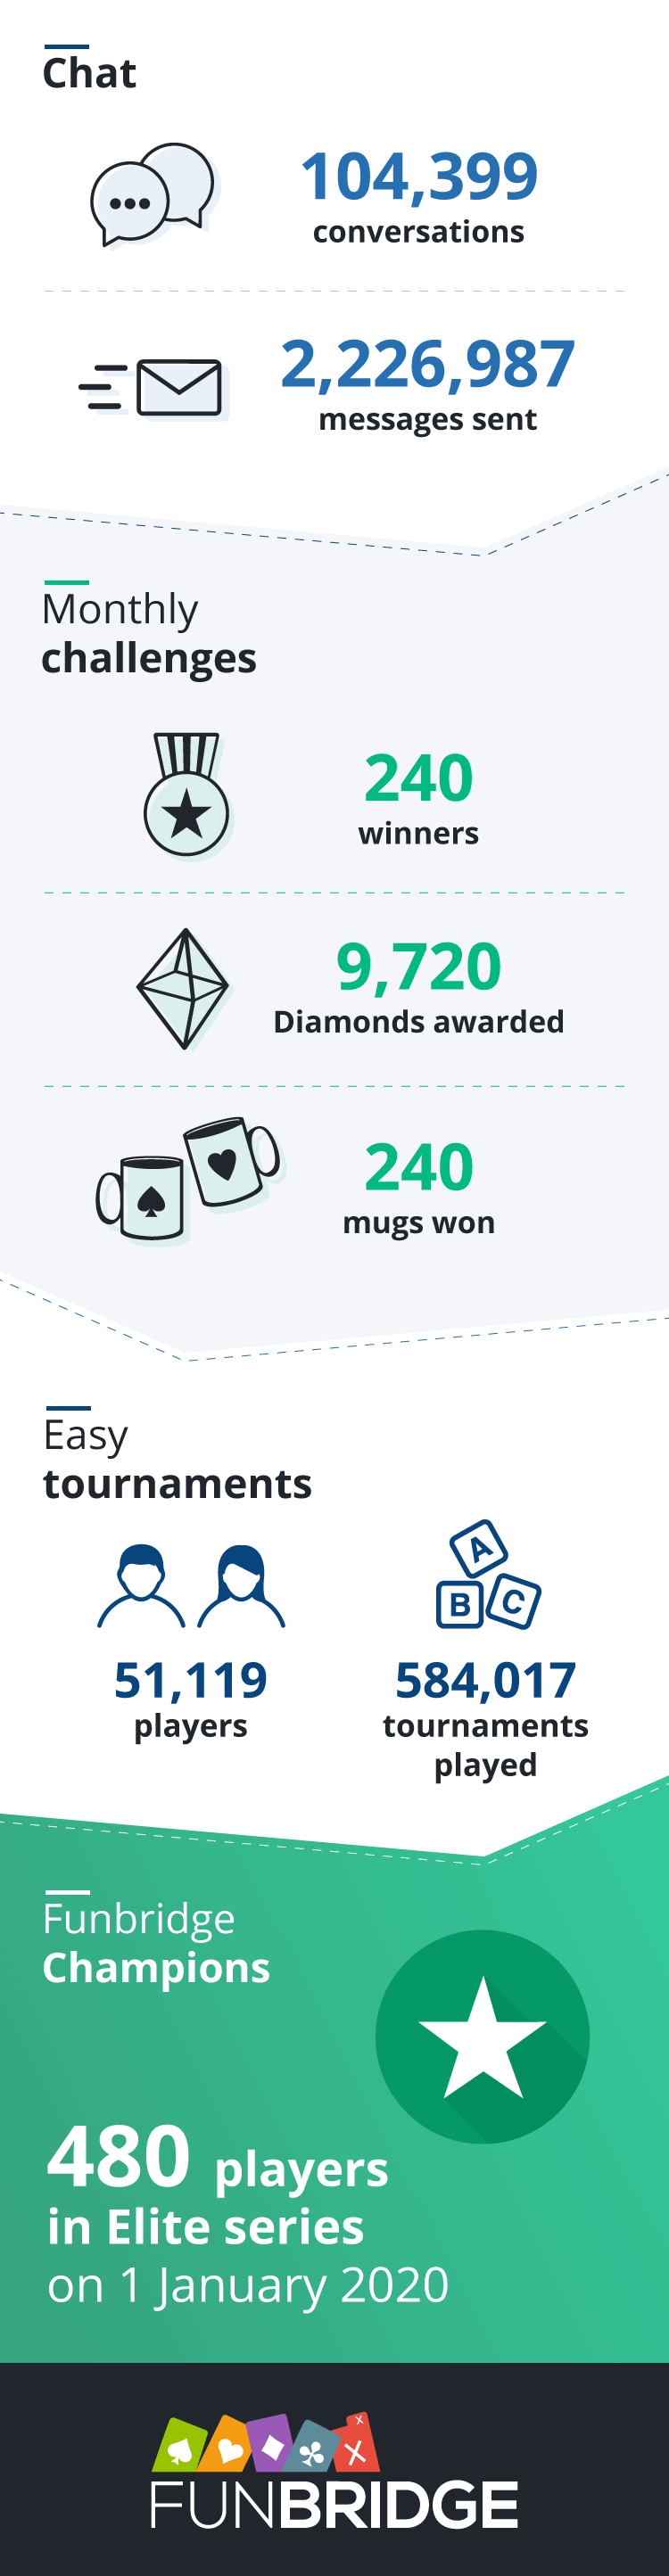
Your 2019 Year in Figures
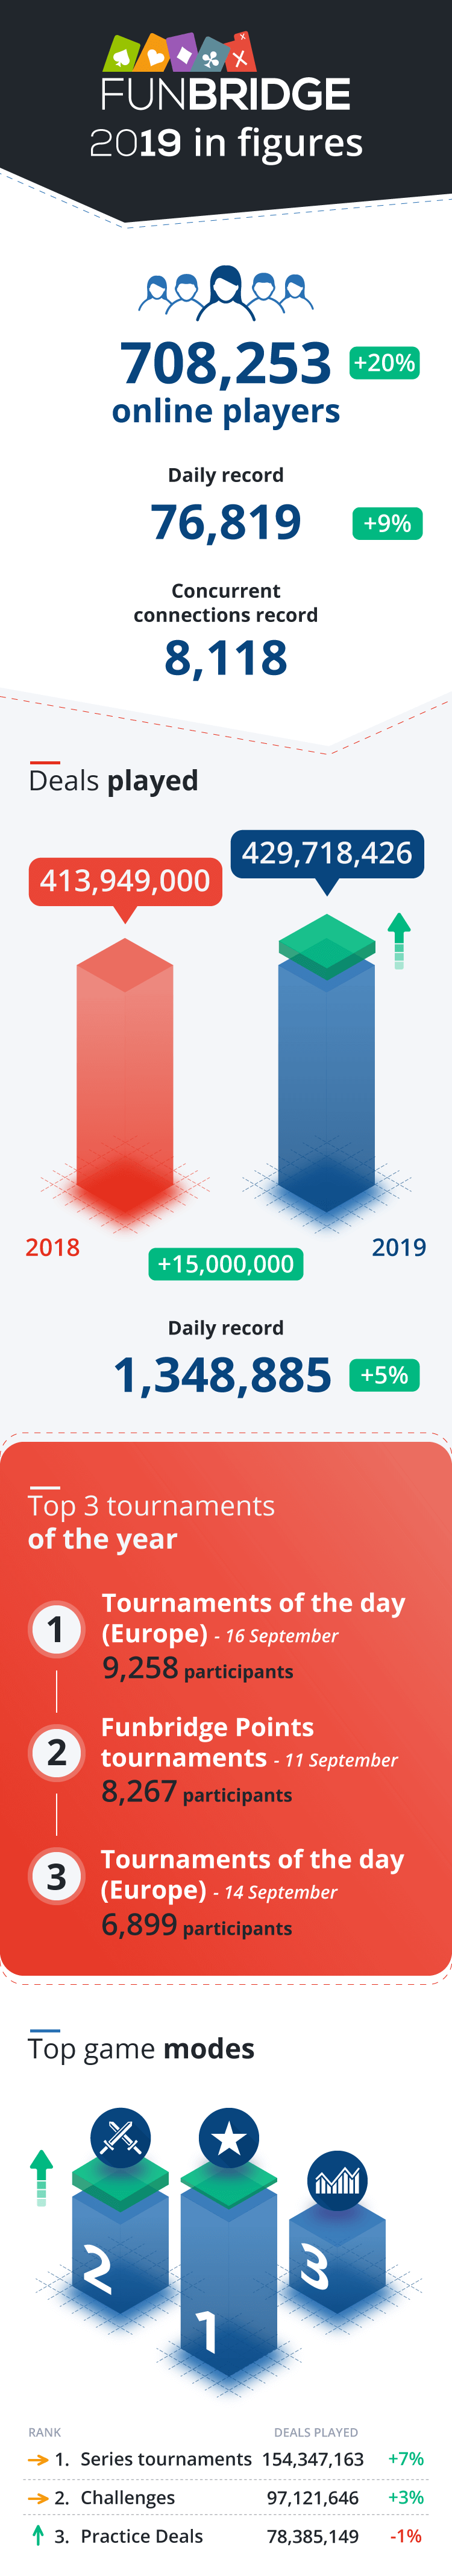
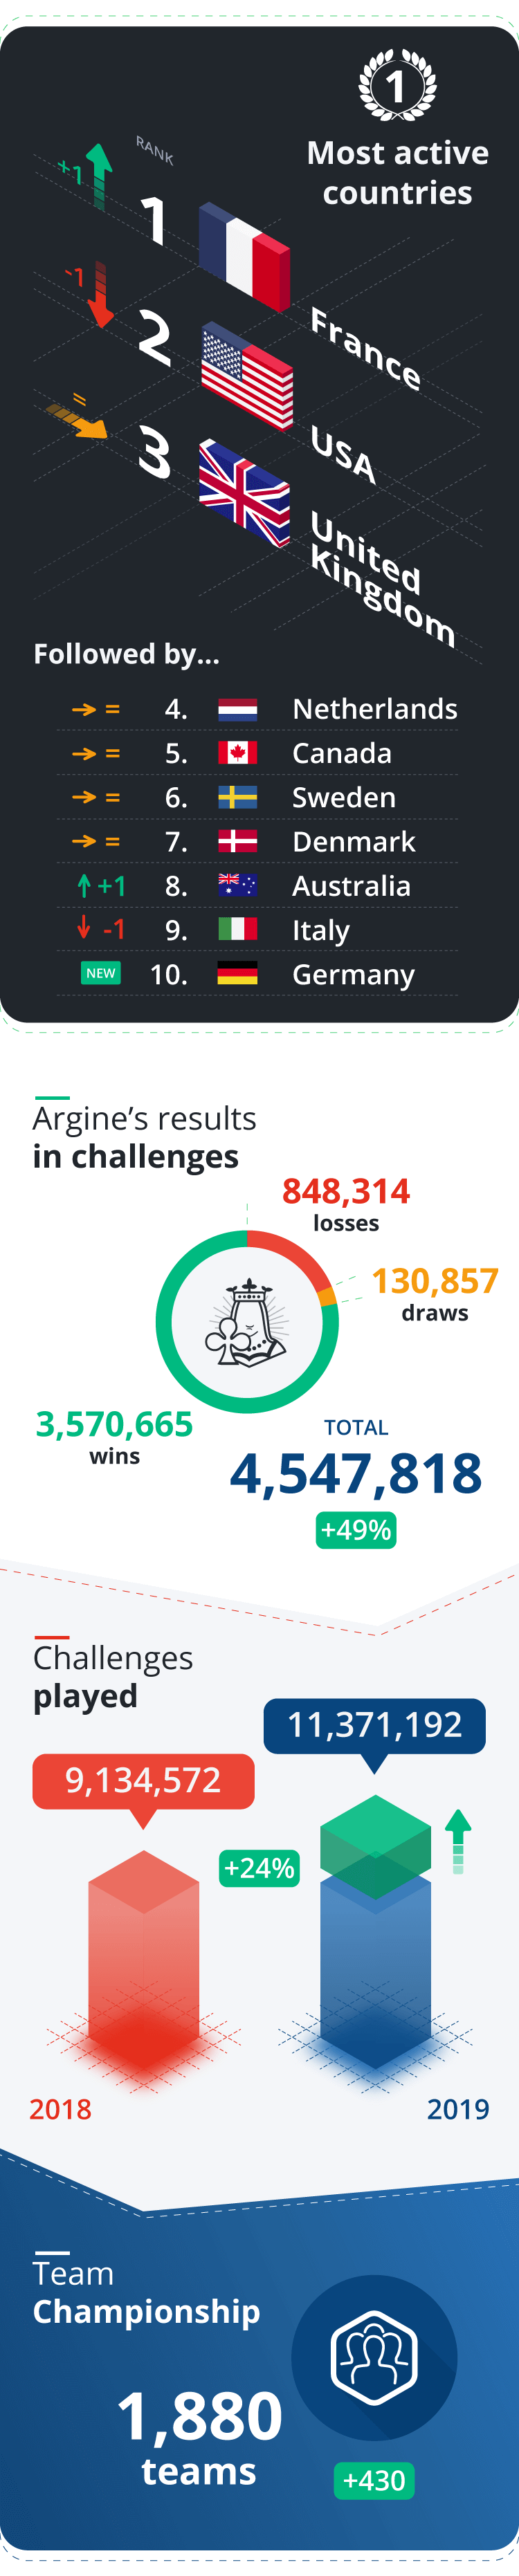
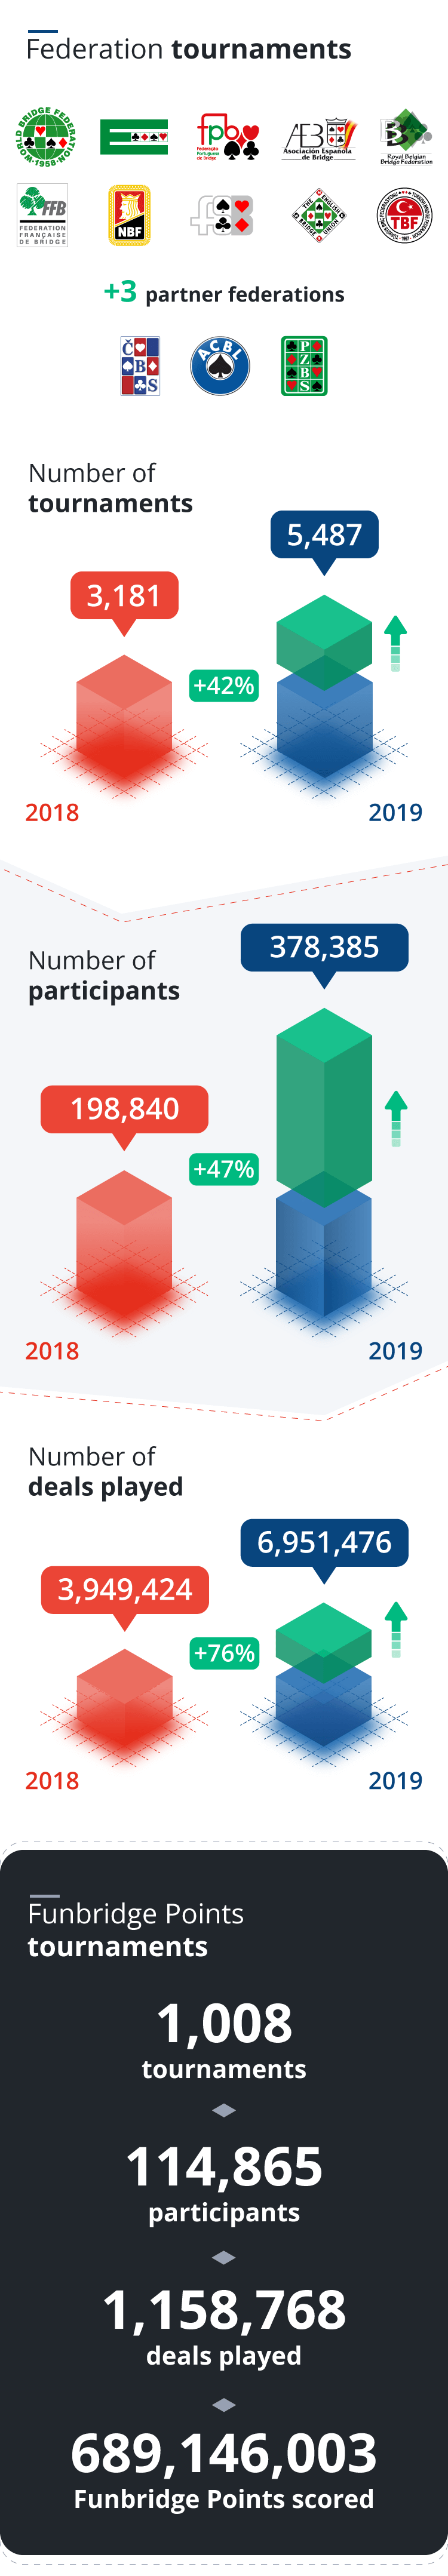
The 2019 edition of the yearly Funbridge infographic is out! Find out more about how many people play on Funbridge, their favourite game modes, the most active countries and much more.
Enjoy reading it!
What do you think about it?
Feel free to comment on this infographic in the comments section below and to share it with your bridge players friends on social networks!
You like this infographic? You will love…


I would have liked to see all the countries that participated.
I wish that when looking at the funbridge statistics, where I see my own score, I could filter the query by country. Thus, I’d be able to see just the scores of say the US players, or all the French players.
Thank you for the Infographic . It shows that Funbridge is a Top App. used by so many bridgers worldwide. And I can play worldwide with everyone in a challenge.I am glad, that The Netherlands is NUMBER 4 in participating countries. Wonderful.
Thank you! Love the app. It’s helped me a lot with learning the game. For US people, would love to be able to search by state to maybe find someone near me.